Page 50 - RFU Annual Report 2017
P. 50

48
                                                     Financial Statements
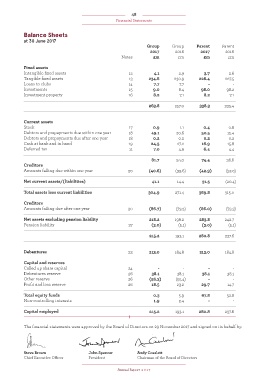

            Balance Sheets
            at 30 June 2017
                                                                  Group      Group      Parent      Parent
                                                                    2017       2016       2017       2016
                                                       Notes         £m         £m         £m         £m

            Fixed assets
            Intangible fixed assets                       12         4.1        2.9         3.7        2.6
            Tangible fixed assets                         13       234.8      230.9      228.4       227.5
            Loans to clubs                                14         7.7         7.7          -         -
            Investments                                   15         9.0        8.4       98.0        98.2
            Investment property                           16         8.2         7.1        8.2        7.1

                                                                   263.8       257.0      338.3      335.4


            Current assets
            Stock                                         17         0.9         1.1       0.4         0.8
            Debtors and prepayments due within one year   18        49.1       20.6        50.5       15.4
            Debtors and prepayments due after one year    18         0.2        0.2         0.2        0.2
            Cash at bank and in hand                      19        24.5        27.2       16.9       15.8
            Deferred tax                                  11         7.0        4.9        6.4         4.4

                                                                    81.7       54.0        74.4       36.6
            Creditors
            Amounts falling due within one year           20       (40.6)      (39.6)     (42.9)     (57.0)

            Net current assets/(liabilities)                        41.1        14.4       31.5      (20.4)

            Total assets less current liabilities                  304.9       271.4     369.8       315.0

            Creditors
            Amounts falling due after one year            20       (86.7)      (73.2)     (86.0)     (72.3)

            Net assets excluding pension liability                 218.2       198.2      283.8      242.7
            Pension liability                             27        (3.0)       (5.1)      (3.0)      (5.1)

                                                                   215.2       193.1     280.8       237.6


            Debentures                                    23       213.0       184.8      213.0      184.8

            Capital and reserves
            Called up share capital                       24           -          -           -         -
            Debentures reserve                            26        38.1        38.1       38.1       38.1
            Other reserve                                 26       (56.3)      (55.4)         -         -
            Profit and loss reserve                       26        18.5        23.2       29.7       14.7

            Total equity funds                                       0.3        5.9        67.8       52.8
            Non-controlling interests                                   1.9     2.4           -         -

            Capital employed                                       215.2       193.1     280.8       237.6


            The financial statements were approved by the Board of Directors on 29 November 2017 and signed on its behalf by:


            Steve Brown                 John Spencer          Andy Cosslett
            Chief Executive Officer      President            Chairman of the Board of Directors


                                                     Annual Report  2017
   45   46   47   48   49   50   51   52   53   54   55