Page 48 - RFU Annual Report 2017
P. 48

46
                                                     Financial Statements


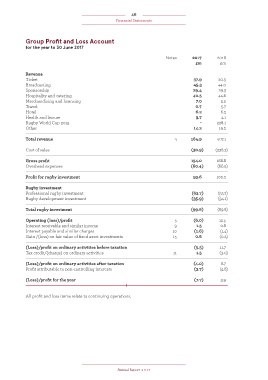
            Group Profit and Loss Account
            for the year to 30 June 2017

                                                                           Notes      2017        2016
                                                                                        £m         £m

            Revenue
            Ticket                                                                     37.9       20.3
            Broadcasting                                                               45.3       44.0
            Sponsorship                                                                29.4       29.3
            Hospitality and catering                                                   40.5       44.6
            Merchandising and licensing                                                 7.0        5.5
            Travel                                                                      0.7        5.7
            Hotel                                                                       6.2        6.3
            Health and leisure                                                          3.7        4.1
            Rugby World Cup 2015                                                          -      228.1
            Other                                                                      14.2       19.2

            Total revenue                                                      4      184.9      407.1

            Cost of sales                                                             (30.9)     (238.3)

            Gross profit                                                              154.0      168.8
            Overhead expenses                                                         (60.4)      (66.5)

            Profit for rugby investment                                                93.6      102.3

            Rugby investment
            Professional rugby investment                                             (63.7)      (55.7)
            Rugby development investment                                              (35.9)      (34.1)

            Total rugby investment                                                    (99.6)      (89.8)

            Operating (loss)/profit                                            5       (6.0)      12.5
            Interest receivable and similar income                             9        1.5        0.8
            Interest payable and similar charges                              10       (1.6)       (1.4)
            Gain /(loss) on fair value of fixed asset investments             15        0.6        (0.2)

            (Loss)/profit on ordinary activities before taxation                       (5.5)       11.7
            Tax credit/(charge) on ordinary activities                        11        1.5        (3.0)

            (Loss)/profit on ordinary activities after taxation                        (4.0)       8.7
            Profit attributable to non-controlling interests                           (3.7)       (4.8)

            (Loss)/profit for the year                                                 (7.7)       3.9


            All profit and loss items relate to continuing operations.


                                                     Annual Report  2017
   43   44   45   46   47   48   49   50   51   52   53