Page 78 - RFU Annual Report 2017
P. 78

76
                                                     Financial Statements
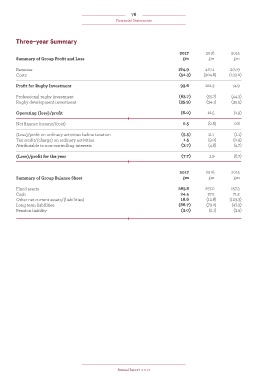


        Three-year Summary


                                                                                 2017       2016        2015
        Summary of Group Profit and Loss                                          £m          £m         £m

        Revenue                                                                 184.9       407.1      207.9
        Costs                                                                    (91.3)    (304.8)     (133.0)

        Profit for Rugby Investment                                              93.6       102.3       74.9

        Professional rugby investment                                           (63.7)       (55.7)     (44.3)
        Rugby development investment                                            (35.9)       (34.1)     (32.5)

        Operating (loss)/profit                                                  (6.0)       12.5        (1.9)

        Net finance income/(cost)                                                 0.5        (0.8)       0.8

        (Loss)/profit on ordinary activities before taxation                      (5.5)      11.7        (1.1)
        Tax credit/(charge) on ordinary activities                                 1.5       (3.0)       (0.9)
        Attributable to non-controlling interests                                 (3.7)       (4.8)      (4.7)

        (Loss)/profit for the year                                                (7.7)       3.9        (6.7)


                                                                                 2017       2016        2015
        Summary of Group Balance Sheet                                            £m          £m         £m

        Fixed assets                                                            263.8       257.0       257.3
        Cash                                                                     24.5        27.2        71.2
        Other net current assets/(liabilities)                                   16.6        (12.8)    (123.3)
        Long term liabilities                                                   (86.7)       (73.2)     (47.3)
        Pension liability                                                        (3.0)        (5.1)      (3.5)


                                                     Annual Report  2017
   73   74   75   76   77   78   79   80   81   82   83